
- Student Group: Northwestern University Master of Science in Analytics (MSiA)
- Team Members: Grace Cui, Johnny Chiu, Matt Gallagher, Veronica Hsieh, Vincent Wang
- Client: British Petroleum (BP) North America
1. Problem Statement
In order sustain growth and competitive differentiation in the fuel market, BP would like to better understand factors that drive demand growth and customer retention by utilizing the vast amount of customer transaction data at their disposal. Currently, BP has released the consumer loyalty product (Driver Rewards) and developed an initial Consumer Lifetime Value (LTV) projection. However, there are opportunities to expand upon the current model as it primarily focuses on group-level internal data where customers are segmented by activity type.
A great value add for the marketing team would be a more comprehensive customer segmentation model which takes into account prior behavior, seasonality, jobber data, and other relevant external data sources such as geographical and macroeconomic drivers. Furthermore, a more dynamic LTV model where the inputs can be variable and be customizable by customer group would offer the marketing team the opportunity to forecast LTV at an individual, segment and group level on-demand as well as build a comprehensive marketing strategy which targets specific reward consumer groups and ultimate drive the incremental margin of rewards.
2. Purpose and Objectives
The NU student group will accomplish the following objectives:
- Data Strategy
- Identify external data sources to enable better customer segments.
- Perform exploratory data analysis and provide BP with a clear understanding of project related data.
- Customer Insights
- Perform a customer segmentation analysis based on internal and external data
- Provide findings for each segment and propose actionable strategies according to the behavior of different groups to drive incremental volume of rewards.
- Consumer Lifetime Value
- Provide a Consumer Lifetime Value model which help BP to determine of the optimal level of investments in marketing and sales activities.
3. Project Deliverables
The NU student group will be responsible for completing the following:
- Customer Segmentation Clustering Evaluation
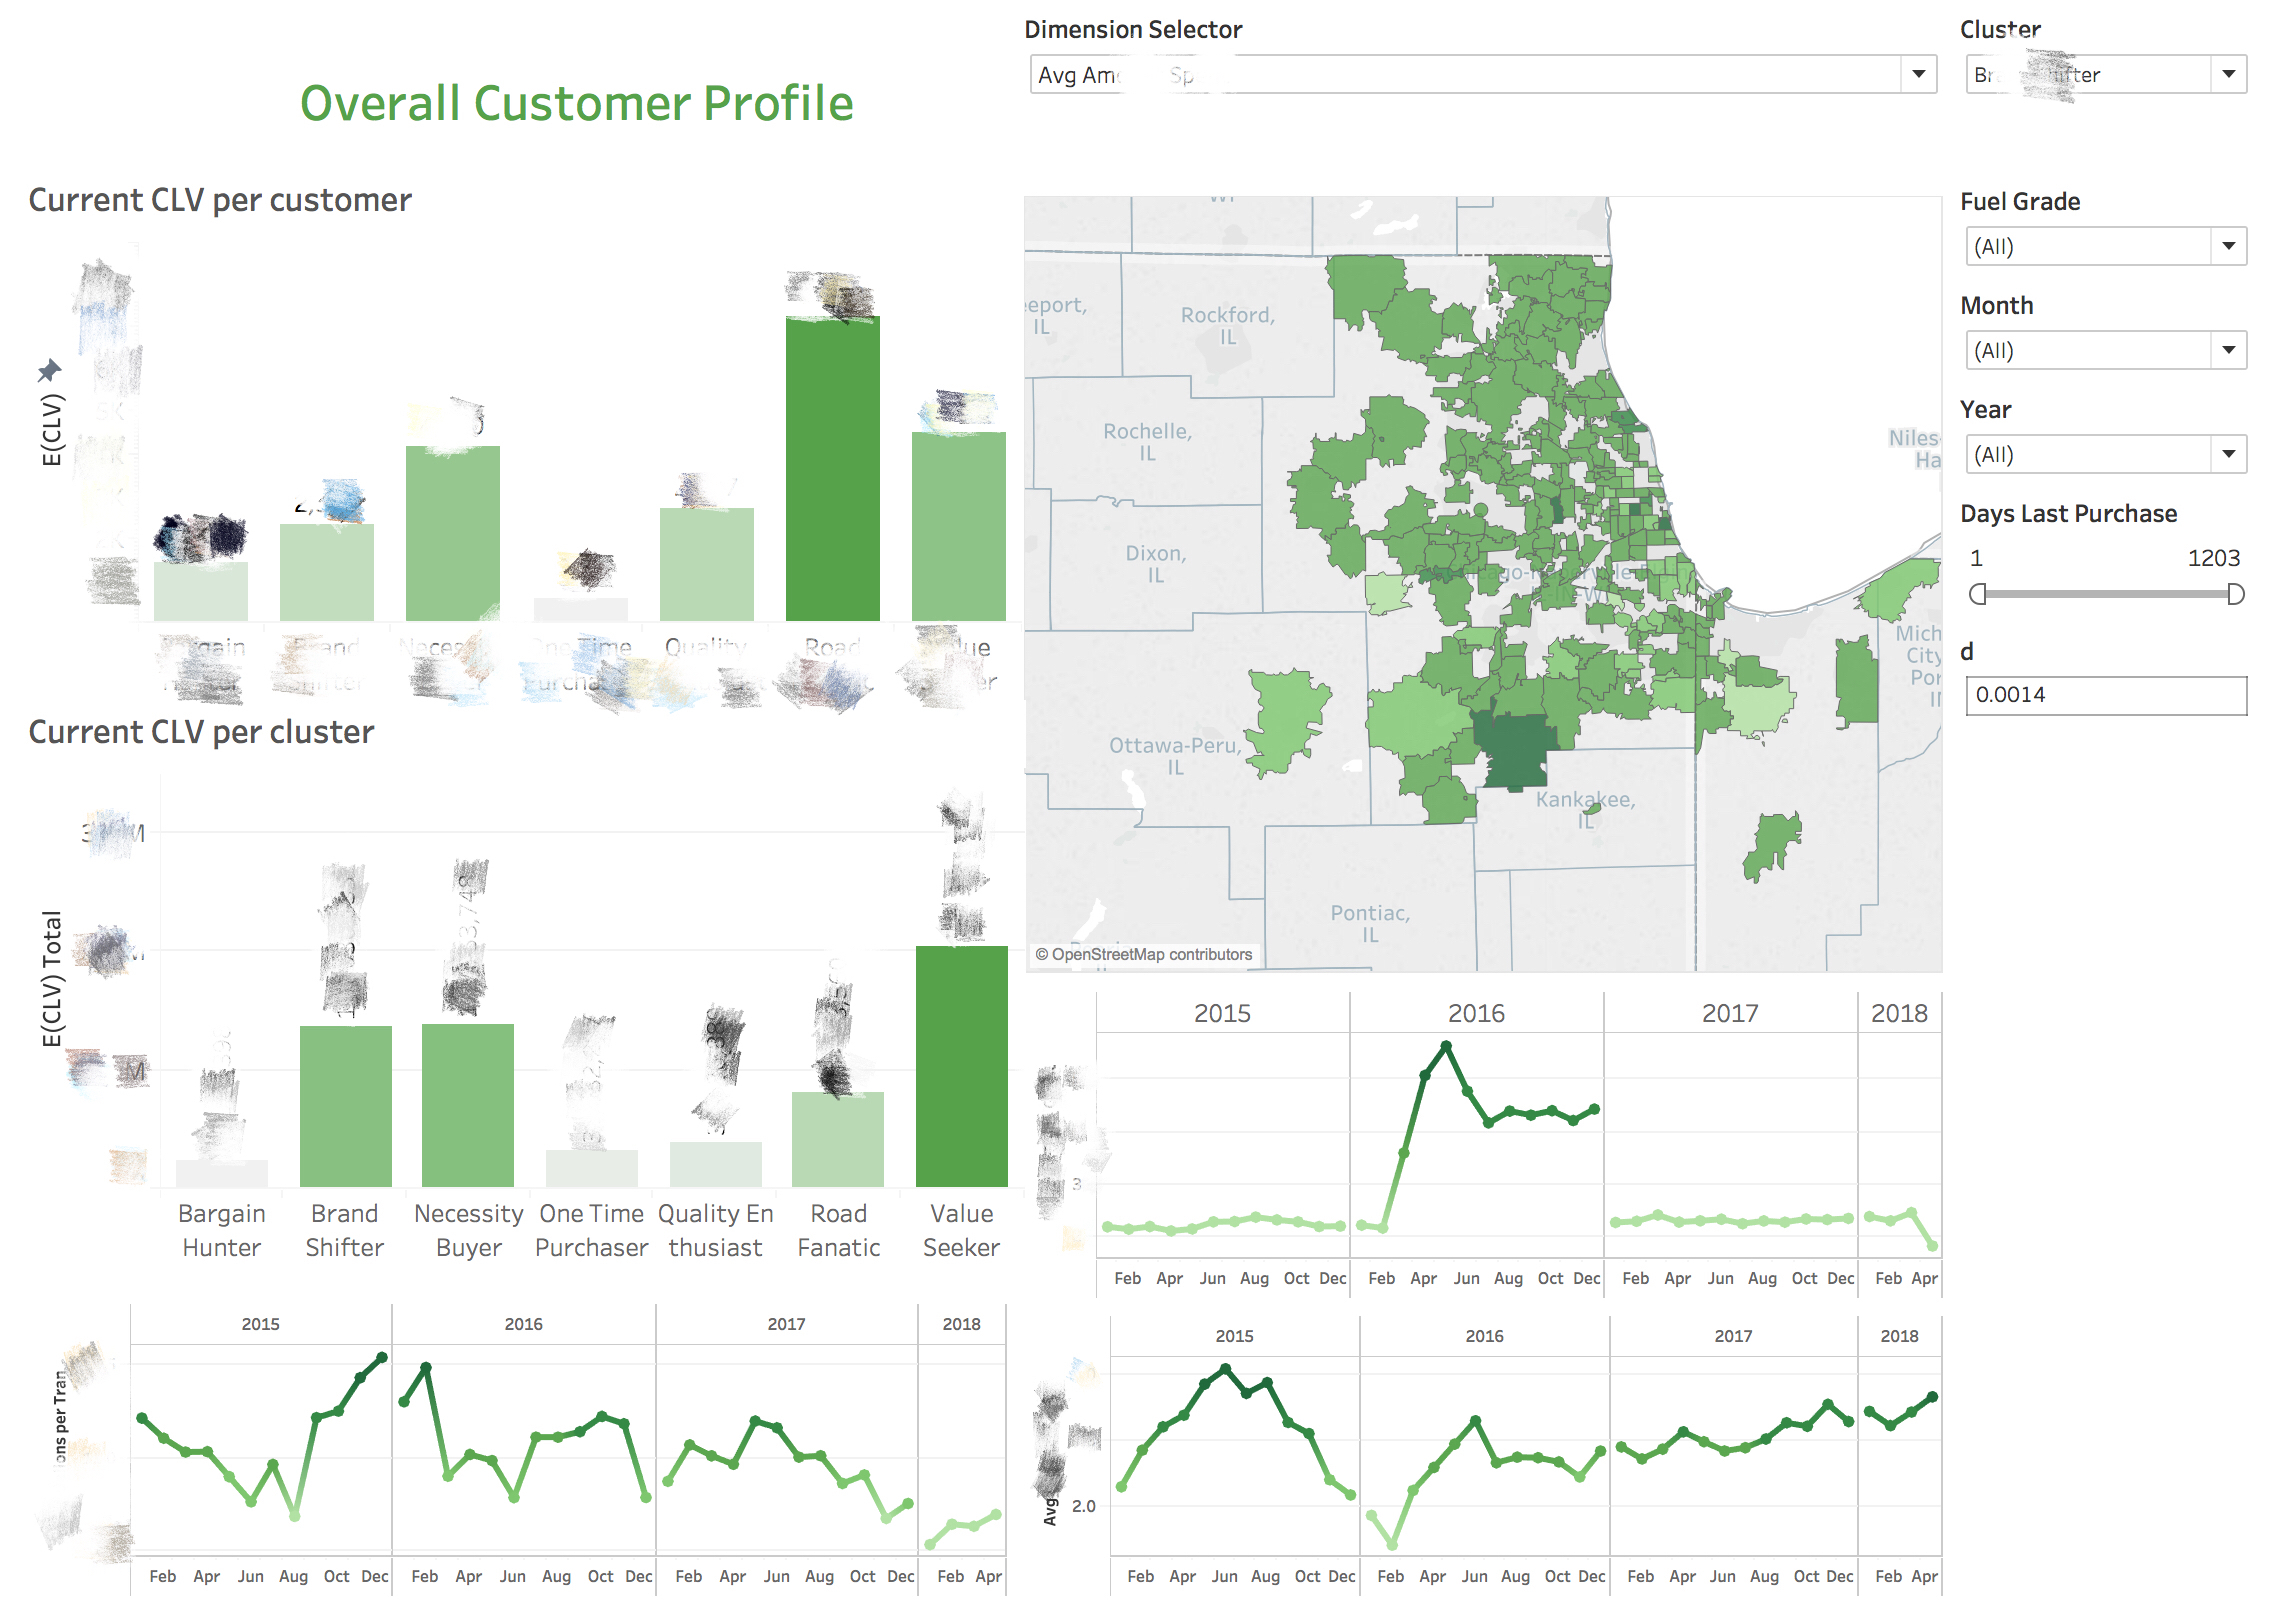
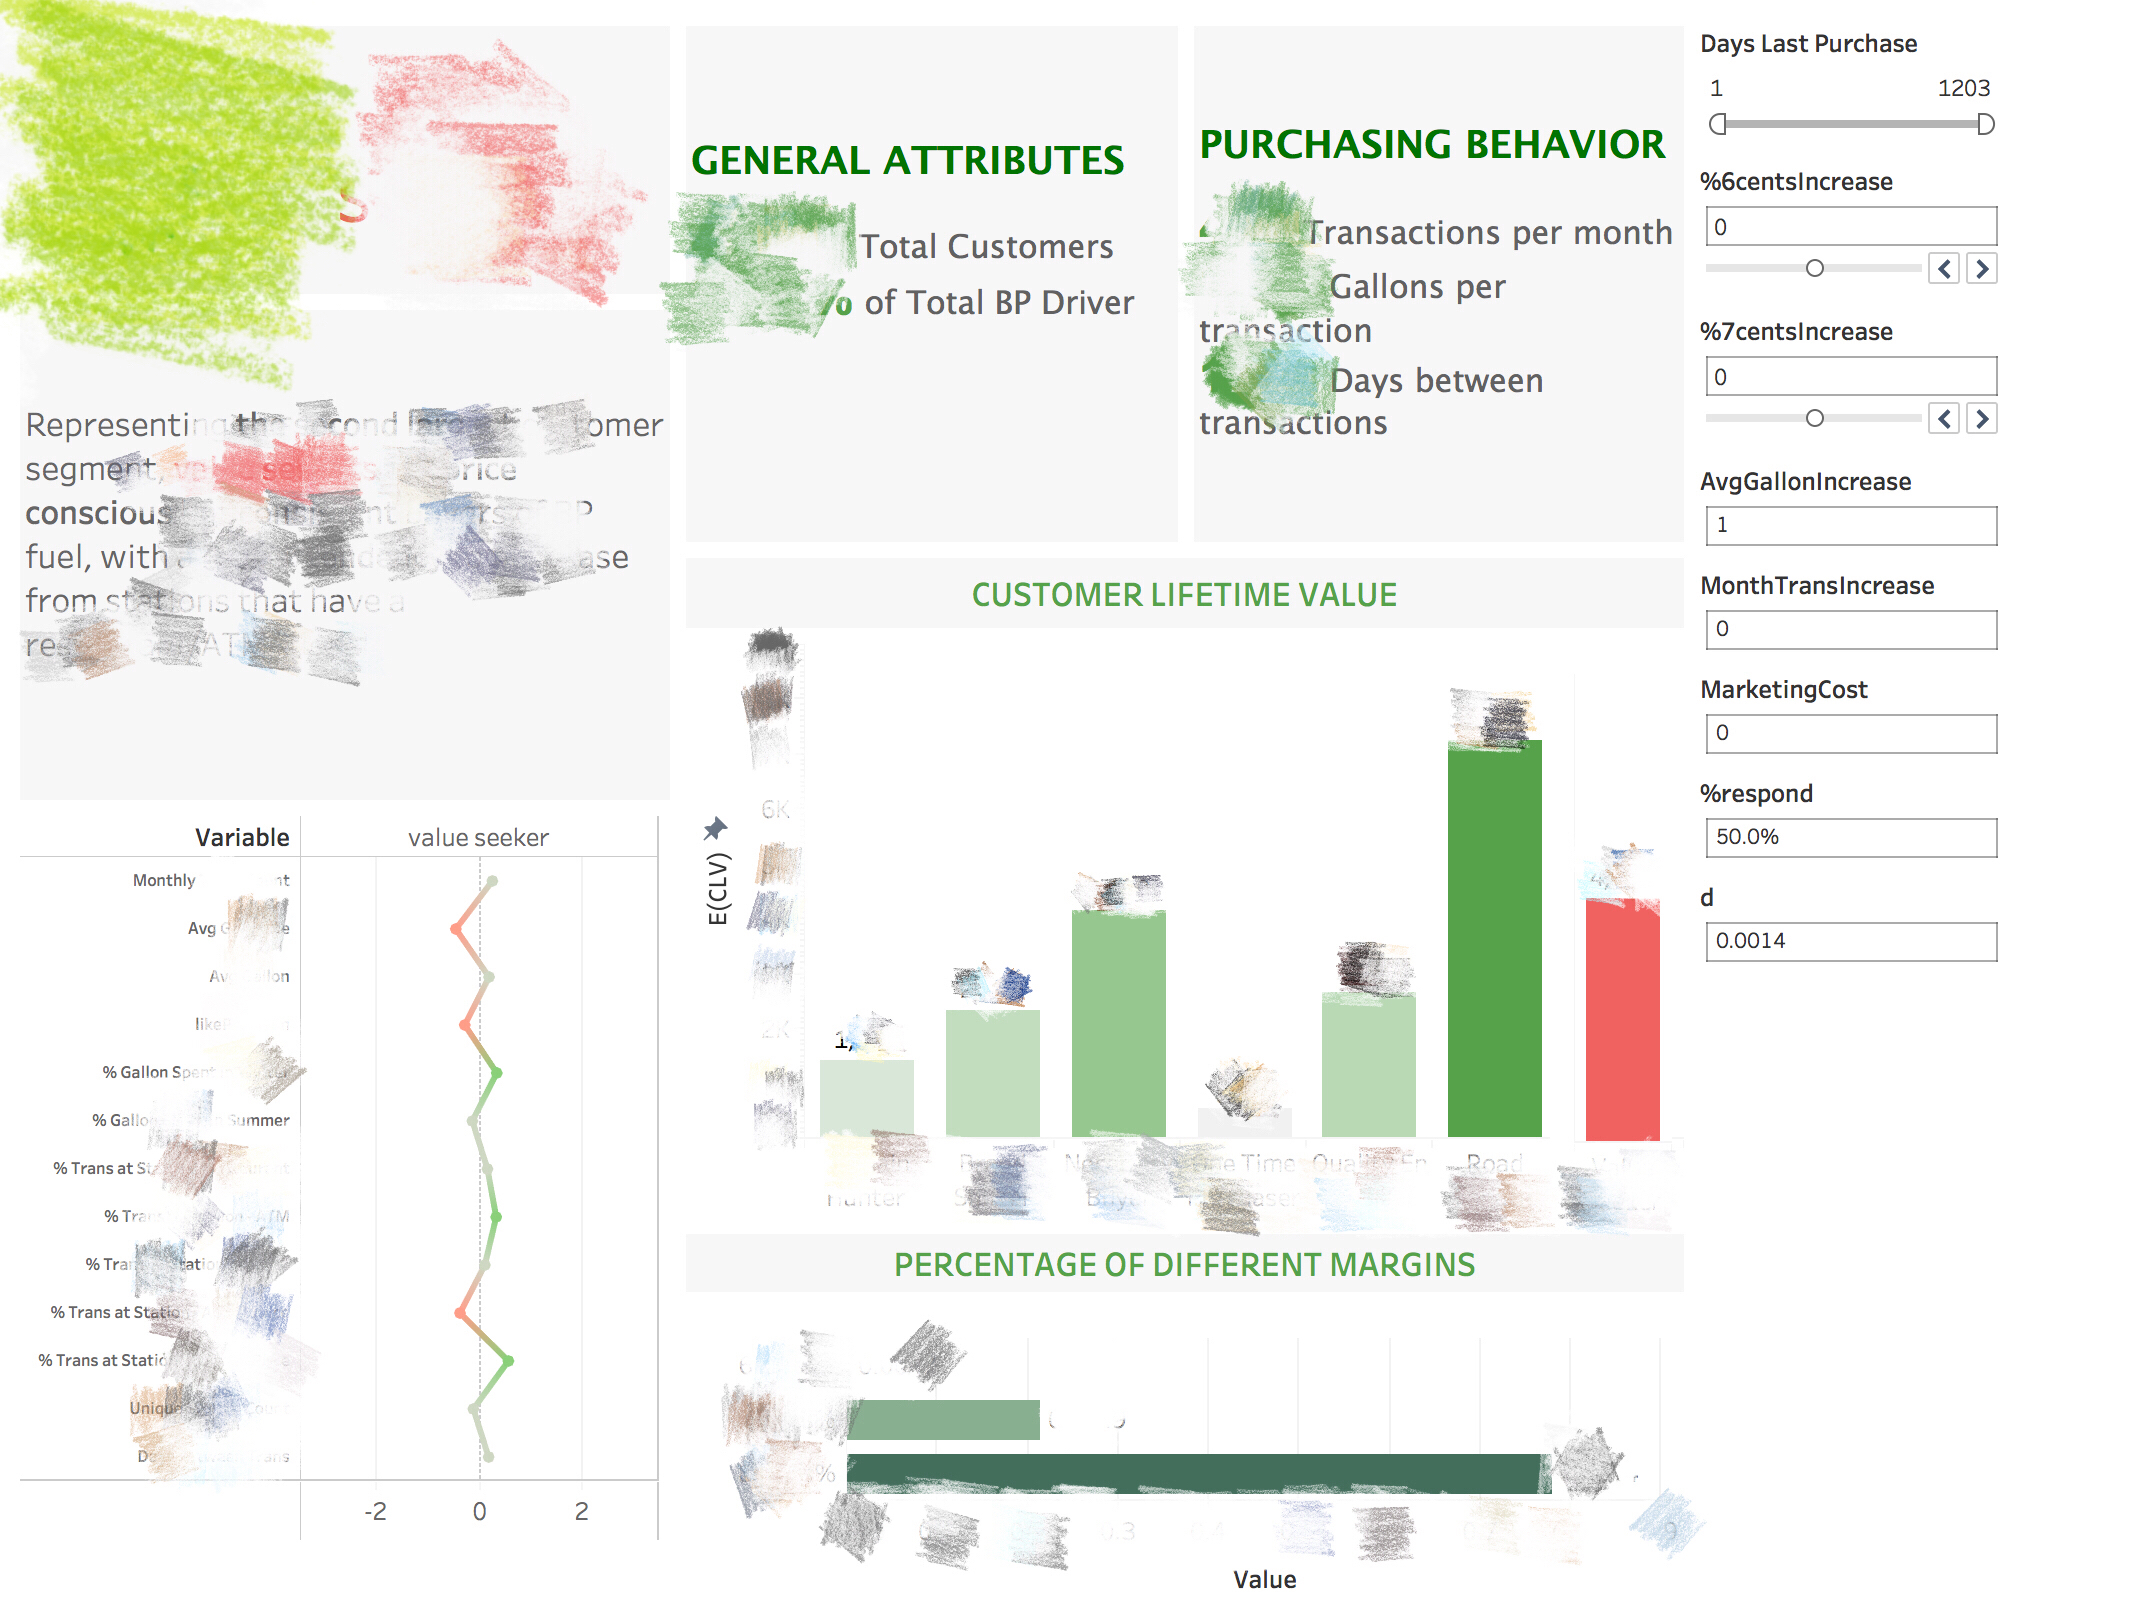
- Customer Segmentation and CLV Model Dashboards
- Final Report with executive summary, analyses, and recommendations
- Analysis tool with instructions for utilization, implementation, and maintenance
4. Final Report
The first deliverable will be a final report that will detail all of the findings by the NU student group and provide recommendations for accomplishing BP’s strategic objectives. The final report will include an assessment of BP’s current data strategy and model. The assessment will document all relevant internal BP data sources used for analysis and their significance in helping solve the key business problem.
We will also include an evaluation of BP’s current LTV model. Finally, the data strategy assessment will provide opportunities and strategies for integrating data. This will capture integration of internal data and may include external data applicable to customer segmentation analysis and further customer insight.
Information that will allow BP to better understand their drive rewards customers will be in the final report. This will include:
- Descriptive statistics about the effectiveness of current driver rewards program.
- An explanation of the customer groups that are identified through customer segmentation analysis and their significance.
- A more flexible LTV model based on different customer segments.
5. Analysis Tool
Several of the analyses will result in the creation of an analytical tool. This tool will allow BP users to repeat these analyses in the future using their most current data. The analyses conducted by the NU student group that will be beneficial for BP moving forward are:
- Customer segmentation analysis
- Consumer Lifetime Value (LTV) analysis
The NU student group will provide details about how to utilize this tool appropriately, and reference a technical specification that is written about the analytical tool. The technical specification will provide details on how the tool is built within the framework of the chosen technology and can be utilized by the information technology group for future modifications and maintenance. Common resources for support will also be outlined in the final report to enable future maintenance of the solution. Work instructions on usage of the tool will be created as a separate document and referenced in the final report.
6. Presentations
Project progress and successes will be presented to key BP project stakeholders on a quarterly basis. These presentations will occur at the end of the Winter and Spring quarter, and more details on the timing can be found in Section 7 - Timeline. A final presentation will be made to the key BP project stakeholders that will include observations and insights that are contained in the final report. Section 7 - Timeline states when the final presentation will take place.
7. Business Benefits
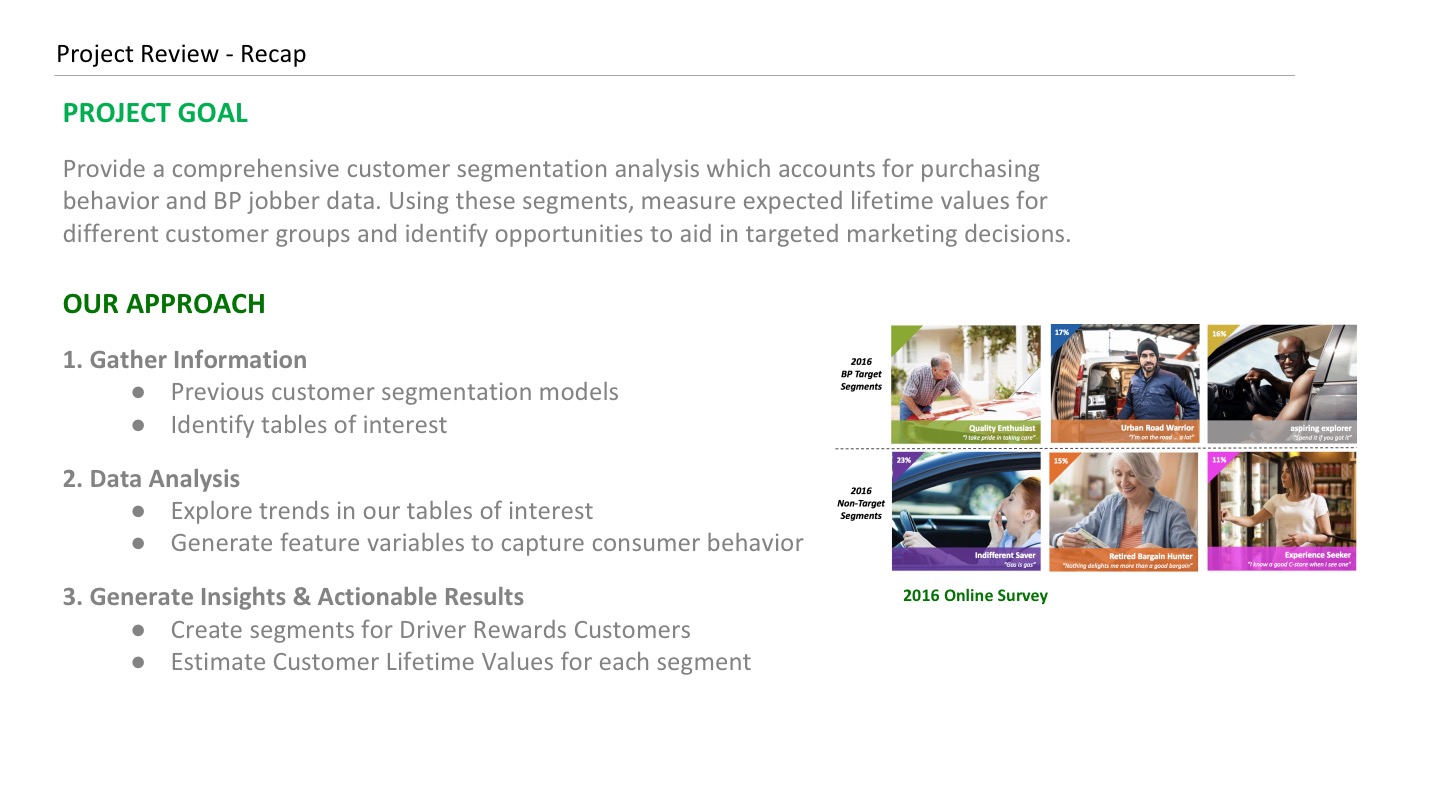
The NU student group will collaborate with BP in finding way to increase customer lifetime value by accomplishing the project objectives. Exploratory data analysis is a critical first step when developing a strong analytics practice. Robust and complete data is needed to conduct meaningful analysis, and a strong understanding of the data is required to correctly interpret the results.
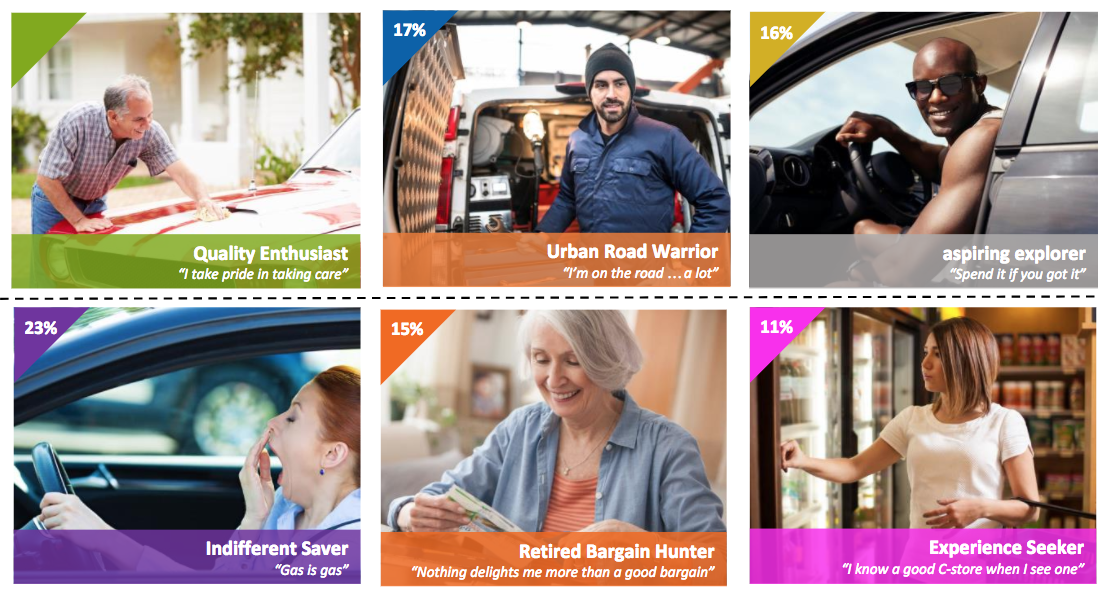
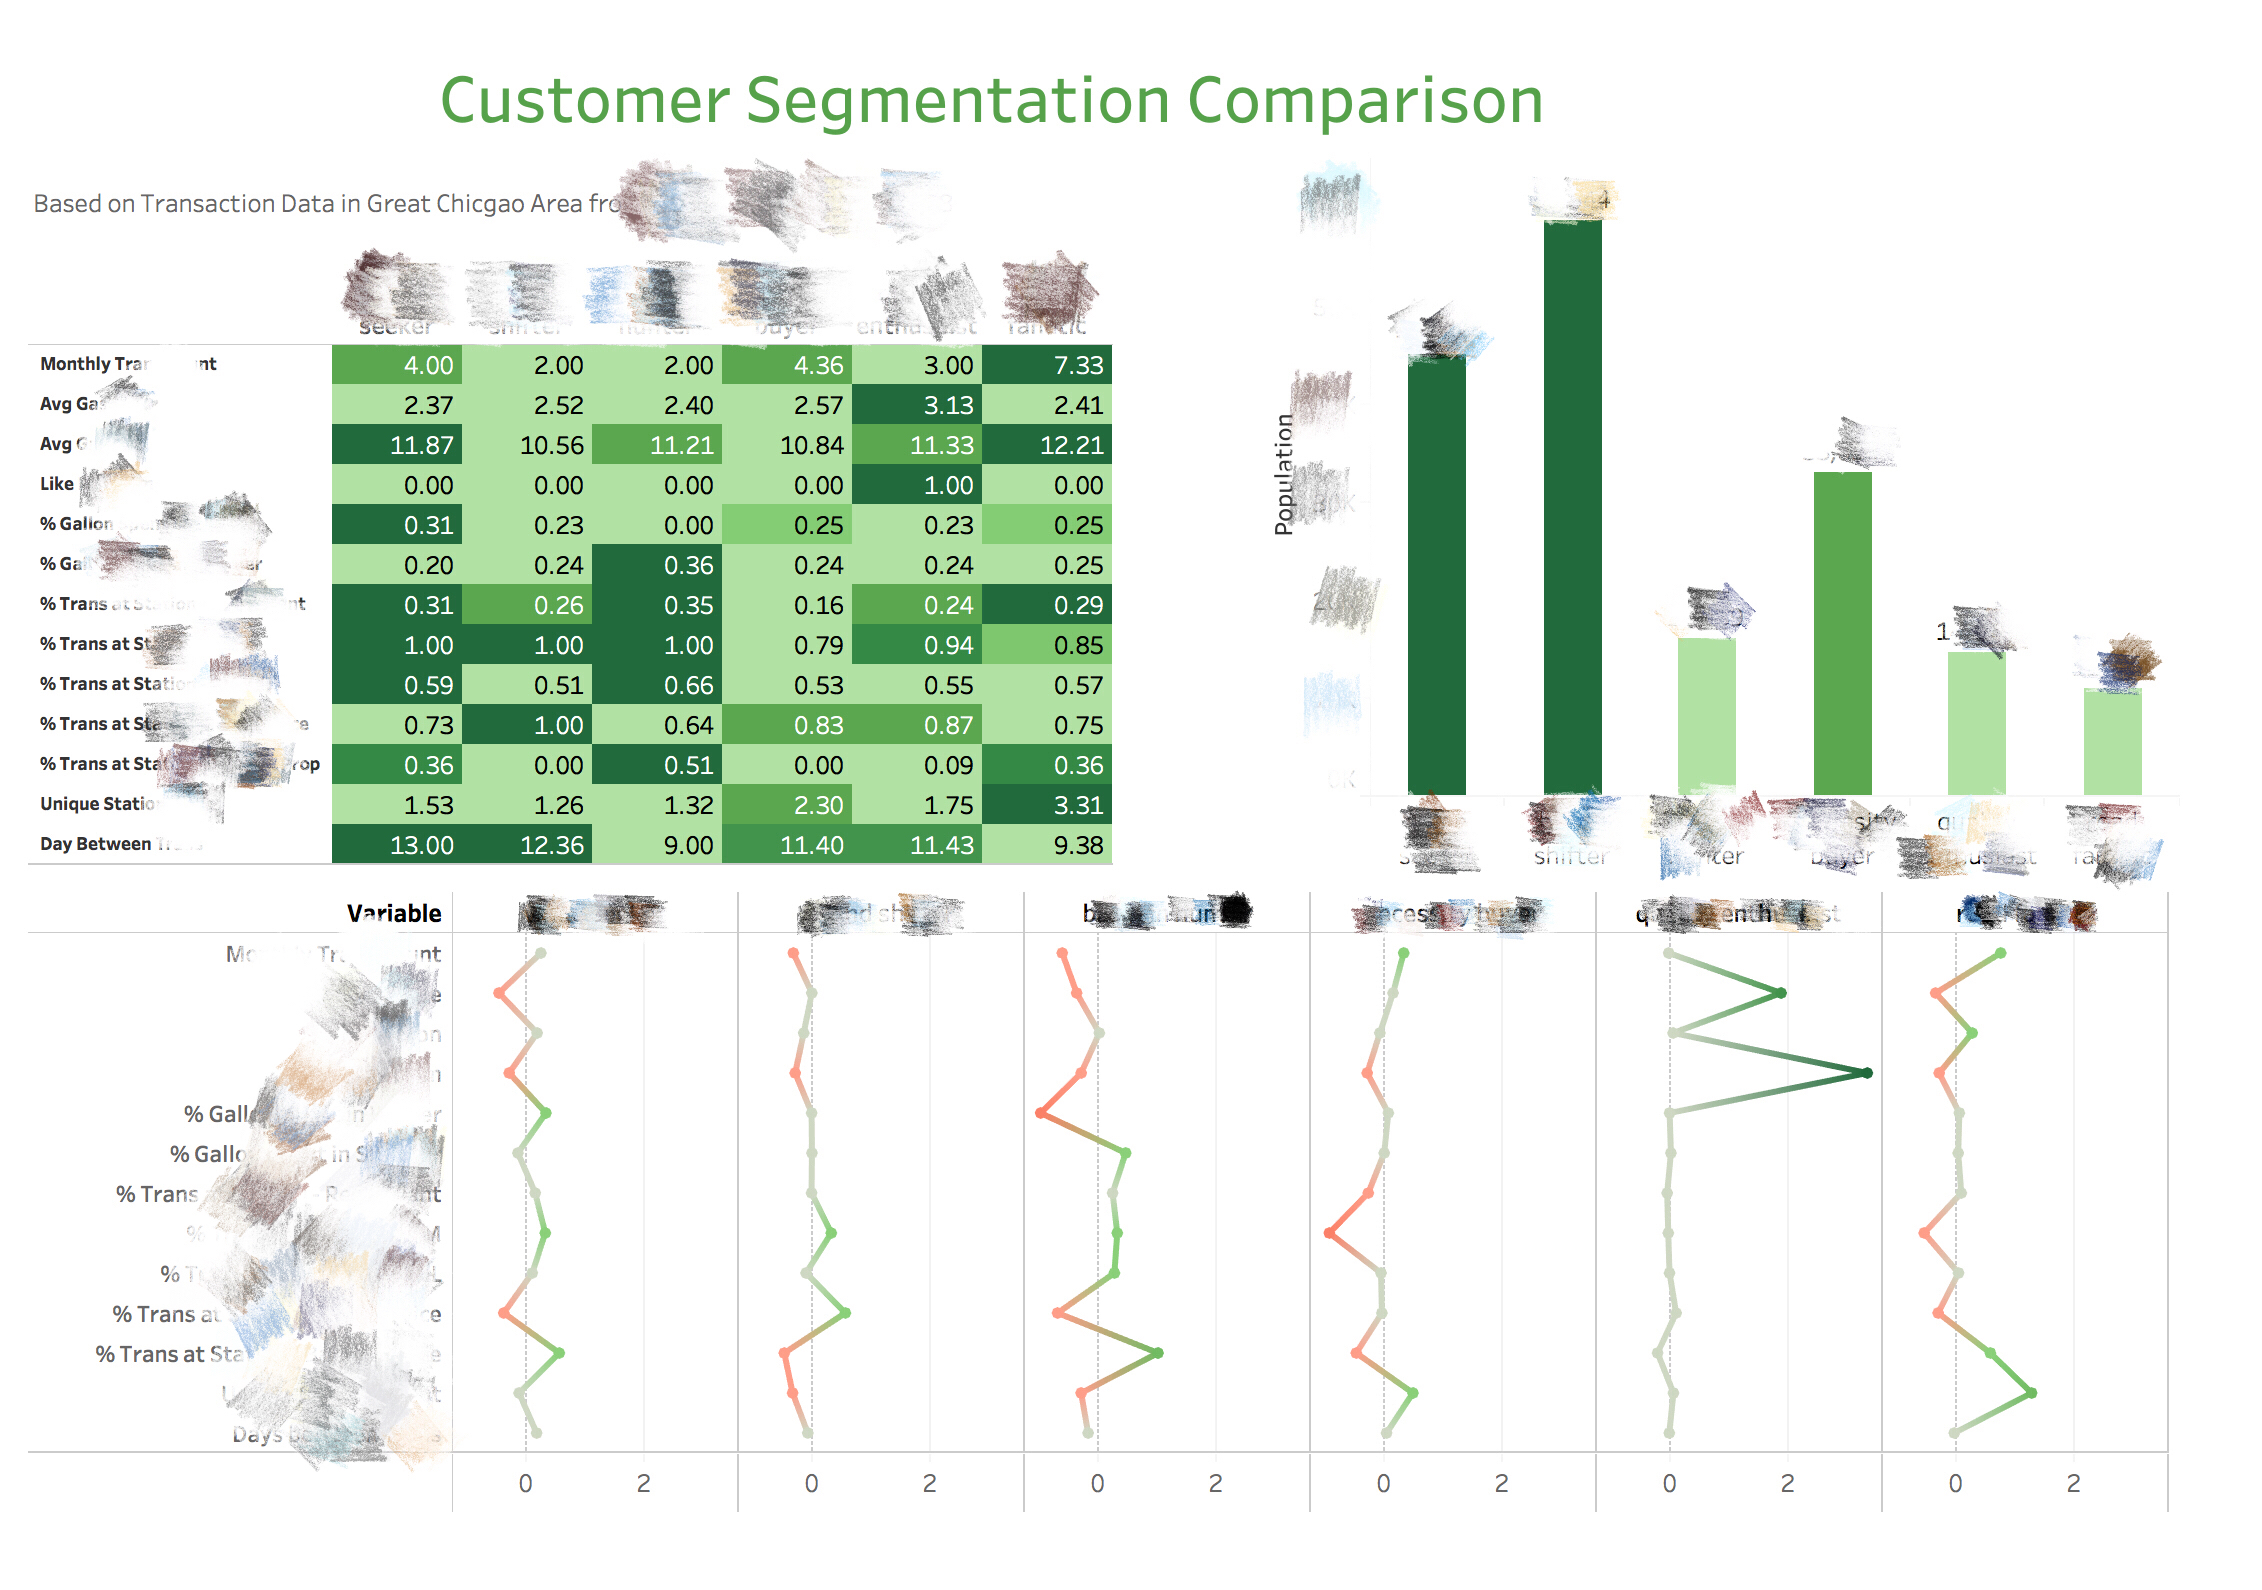
Performing a customer segmentation analysis can help BP to gain a better understanding of their driver reward program participants. The results of the segmentation analysis will provide categories that should be used to segment their customers into groups based on common attributes. Grouping customer into different segments, and knowing the behavior of each segment will help BP design a more efficient marketing strategy to increase retention rate and thus drive the customer lifetime value.
Understanding the lifetime value of customer at an individual, segment and group level provides great value as it informs better marketing decisions. A sustainable LTV model will allow BP to have a better evaluation of budget allocation and to monitor the impact of management strategies and marketing investments. This will allow BP to dedicate more resources toward the acquisition and retention of valuable customers and increase incremental volume of rewards
8. Tools and Methods
The analysis tool will take data input from BP’s data lake and provide the user relevant information by leveraging the results obtained from analyses performed. There are several applications that can be used to develop the tool. The NU student group will select the most appropriate application based on ongoing discussions with BP. Listed below are just a few of the various analytical methods that may be used to perform the analysis that outlined above.
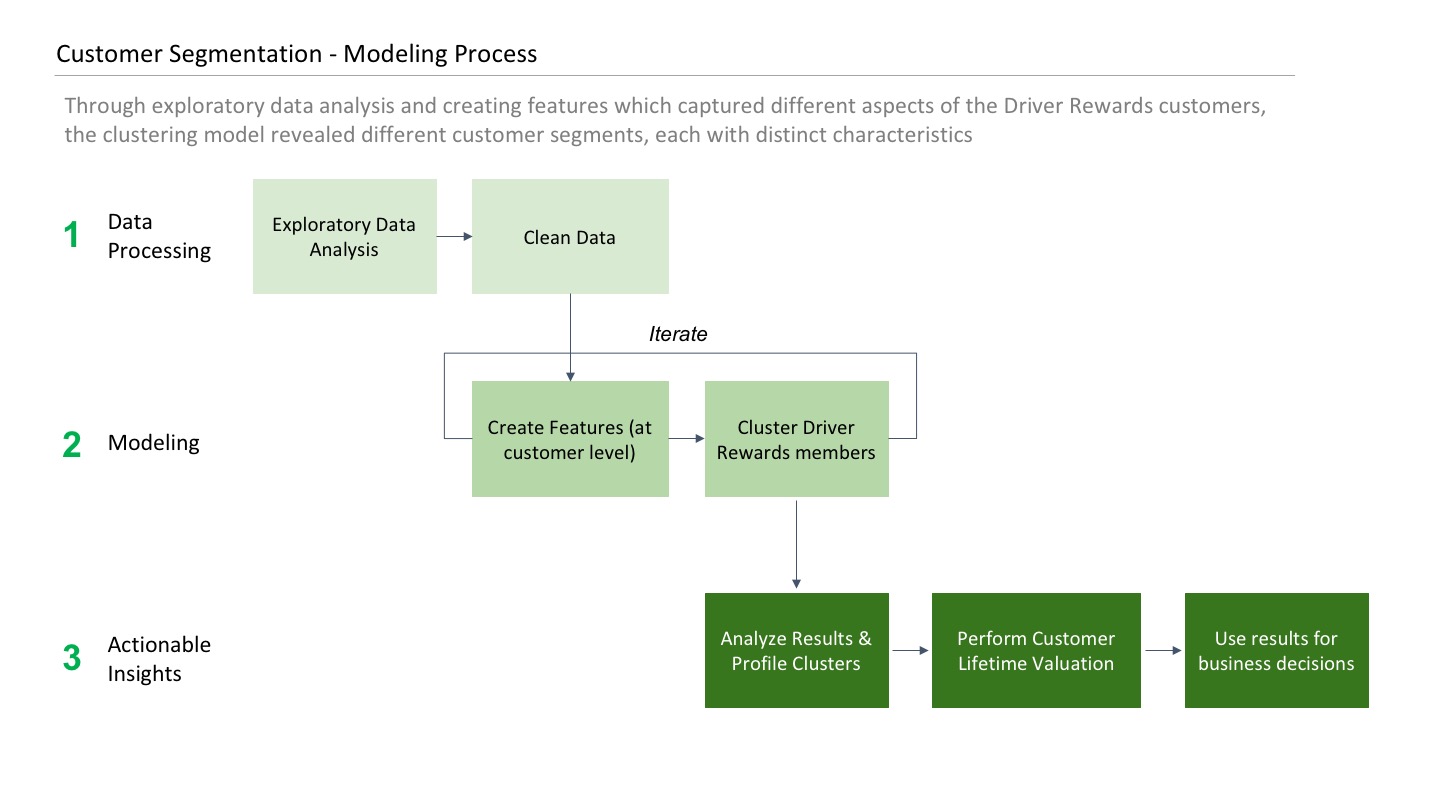
For example, customer segmentation can be accomplished by performing a clustering analysis using principal component analysis and k-means and other unsupervised methods, or through the use of decision trees such as CART. Building the LTV model can be achieved through supervised segmentation model, migration model using Markov chain, and time series analysis. The NU student group will consider all appropriate options based on the data that is available.
Statistical analysis that the NU student group performs will be done primarily using Python and R. Visualization will mostly be done in Tableau.
Note: The programming languages to be used are subject to change based on integrations available with the BP platform
9. Scope
The NU student group will complete the items outlined in Section 3 - Project Deliverables. Any deliverables not listed are not required for completion. The NU student group will review and analyze Driver Rewards transaction data provided by BP. Other information such as competitor, geographical, and macro-economic data that is considered relevant for the analysis will be incorporated, given that the data is readily available. It is not the NU student group’s responsibility to gain access to private data sources.
All data cleansing techniques used by the NU student group will be captured within BP’s data lake during the data pipelining process. It is not the NU student group’s responsibility to provide BP with additional data cleansing documentation. The NU student group will perform analysis of data using appropriate analytical techniques, present the findings in reports and presentations, and provide recommendations on how the insight could be used to better target BP Driver Rewards customers and enhance the value of each customer group.
Additionally, it is not the NU student group’s responsibility to create a comprehensive marketing strategy based on the findings. The NU student group will provide an analysis and model to facilitate future analysis that incorporates all relevant internal and external data sets. It is within the scope to create a plan to build the Tableau visualization and develop a training plan for the other analytical tools. It is not the NU student group’s responsibility to deliver the training, or provide support after the conclusion of the project on June 16th, 2018. The NU student group will work within the technologies and platforms that are made available to them by the BP IT group.
10. Roles and Responsibilities
BP North America Responsibilities
- Reasonable representation during scheduled meetings
- Providing consistent access to the necessary BP data and IT resources
- Clear communication of expected outcomes
NU Team Responsibilities
- Facilitate bi-weekly meetings for status updates
- Prepare content or deliverables for specified status updates
- Provide transparent communication with BP regarding any project challenges
- Produce the research and analysis required to produce the deliverables
- Maintain the specified schedule for updates and deliverables
10. Contingency/Risks
It may not be possible to produce some deliverables without sufficient quality data provided in a timely manner. The NU team will make every attempt to complete all listed deliverables, but the NU team reserves the right to deem particular portions of the deliverables unfeasible. If such situations are encountered, the NU team will provide reasoning to BP on discovery, and in the final report.