
- Student Group: Northwestern University Master of Science in Analytics (MSiA)
- Team Members: Vincent, Wenjing, Grace, Emma
- Client: Kaggle

1. Problem Statement
In the retailer industry, grocery stores are always in a delicate dance with purchasing and sales forecasting. With a little higher prediction, grocers might be stuck with overstocked, perishable goods; however, with a little lower guess, popular items will quickly sell out, and thus leaving money on the table. This prediction problem becomes more important and complex as retailers plan to add new locations with unique needs, new products, and unpredictable product marketing. Considering the comprehensive data on Corporación Favorita, we decided on this grocery corporation as the predicting target.
2. Purpose and Objectives
We analyzed grocery sales data from Corporación Favorita, a large Ecuadorian-based grocery retailer, and applied 11 supervised machine learning models to forecast products’ unit sales.
3. Dataset
4. Variable and Type
- numeric:
- continuous: unit sales, store_avgtrans_perday, oilprice
- discrete: uniqueday, city_pop
- categorical:
- ordinal: buildingquality type id: high low
- nomial: family, store_type, cluster, holiday
- binary: onpromotion, perishable
- Time series:
- year + month + season
3. Data Cleansing
- Missing values:
- Holiday_type are missing, and the rest are all different holiday types.
- First imputed the missing values as Not Holiday, and then together with the variable Locale
- We created a new feature called holiday with five separate groups:
- Local Holiday
- National Event
- National Holiday
- Not Holiday
- Regional Holiday
- KNN method to impute oil price from the most recent date.
- KNN method to impute if on promotion from the most recent date
- 12% onpromotion observations are missing. using the majority vote from several most recent dates.
- Holiday_type are missing, and the rest are all different holiday types.
- Unit_sale was highly right skewed. Therefore, log transformation
4. Feature Engineering
- Calculated the city population over all the locations of stores and divided them into four ordinal levels based on their population.
- Next, we selected the top 5 best selling items from Jan 1st 2013 to Aug 15th 2017 for the most popular store in each city level as our main focus.
- For purchasing patterns, we calculated the frequency of days on which each item has been sold ( uniqueday ) to measure its popularity and consumability.
- Splitted date information into year and month as two categorical variables to capture the trend across years and seasonality within the year.
- We created the variable season to indicate wet season or dry season in Ecuador. (only two seasons)
- We looked for each city’s population and created a new corresponding field called city_pop.
- We calculated the average transactions per day for each store as a measure of its popularity.
- We standardized all the numeric predictors to make sure that all the models will give the same weights to all the numeric variables
5. Modeling
- Linear Regression
- Response: unit_sales.
- Stepwise and AIC criterion — onpromotion, family, store_type, holiday, uniqueday, oilprice, year, and month , and all of them are significant at 95% level of significance
- VIF — no serious multicollinearity exists
- Uniqueday – influential variable
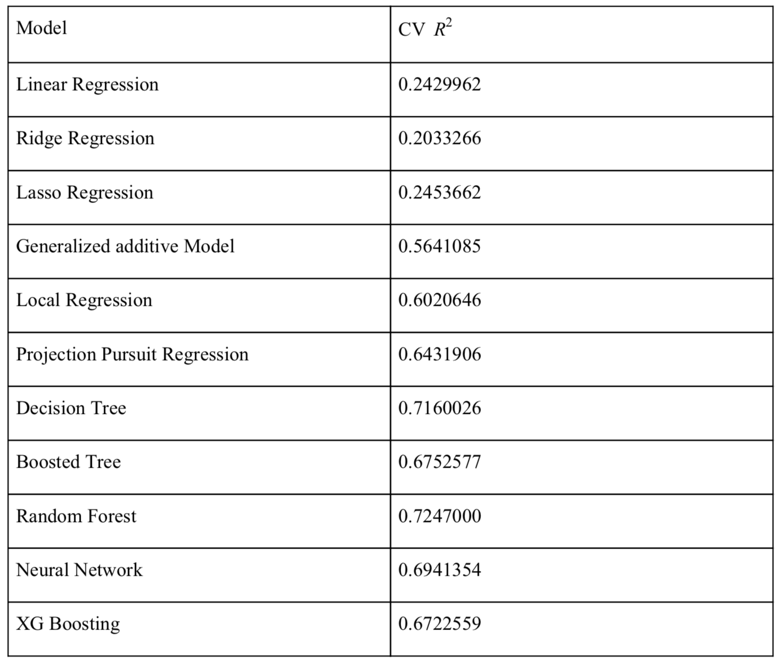
- R2 with 10-fold cross validation is 0.2429962.
- Residual plot, QQ plot — some non-linearities among predictors
- Ridge Regression
- Avoid the potential multicollinearity issue
- Same predictors from initial linear regression
- Therefore, we selected the best lambda with the lowest MSE.
- The average CV R2 was 0.2033266.
- Lasso Regression
- The final 10-fold CV R2 is 0.2453662.
- There was no serious multicollinearity among predictors.
- This explained no significant improvement in CV R2 using Ridge and Lasso regressions compared to the linear regression.
- Generalized Additive Model (GAM)
- We then utilized GAM to the dataset to predict unit_sales .
- Because we had only four numeric variables in the predictors, we applied nonparametric smoothing functions on these predictors, which are store_avgtrans_perday, uniqueday , oilprice , and city_pop .
- The largest CV R2 was 0.5641085 with the smooth parameter as 4.
- The plots of component parameters demonstrated the significantly positive effect of uniqueday on unit_sales . This major effect agreed on the results of previous models.
- Projection Pursuit Regression (PPR)
- cross validation to find the best PPR model by choosing different number of terms.
- CV R2 0.6431906 when nterms equals 5.
- In addition, the plot shows that the effect of predictors for the function varies significantly (Figure 5).
- Based on the coefficients from the first term, we found that perishable and uniqueday have relatively larger coefficients compared to others.
- However, all the coefficients have very small magnitude, which indicates that all predictors do not have significant relationship with the response.This might due to there are too many categorical variables with many levels.
- Decision Tree
- we tried Decision Tree model because it is better to handle categorical variables.
- CV to choose best Cp, X-val Relative Error decreased to 0.3 and became approximately constant afterwards. Through eyeball selection, the Cp equal to 0.00021658 was selected when X-val Relative Error was 0.3. The final CV R2 equals 0.7160026.
- After plotting the best Decision Tree model with the optimal Cp, we discovered that the number of splits is still relatively large (Figure 7). This indicates there exists some potential overfitting problems with the tree model.
- Therefore, we selected Cp as 0.02726257 to make sure the number of splits was in an reasonable range and the best CV R2 now is 0.5913523.
- Gradient Boosting Tree
- n.trees as 5000 and shrinkage as 0.001 to our data.
- CV MSE still decreased significantly when the number of iteration reached 5000, which means the number of trees is still not enough. Therefore, a new boosted tree with n.trees=12000 and shrinkage=0.001 was applied (Figure 10). The average CV R2 is 0.6752577.
- four most important variables are uniqueday, family, city_pop, and store_type (Table 6). As shown in the partial dependence plots of the top four important variables, uniqueday and family both have positive effects on unit_sales while city_pop has a negative impact.
- Random Forest
- best performance was given by the Random Forest with 300 bootstrapped trees and each tree utilizing five random predictors to prune. This gave us CV R2 equal to 0.7247.
- From the selected Random Forest model, uniqueday has the most important effect on predicting items’ unit sales. Family and store_type are also important.
- Specifically, if an item belongs to family PRODUCE, it tends to have a higher daily unit sales. If a store belongs to type B, the items in that store tend to have higher unit sales on average.
- Also, oilprice , which represents the economic status of the day, has a significantly negative effect on unit_sales.
- Local Regression
- Since Local Regression only allows at most four numerical predictors, we chose uniqueday , oilprice , store_avgtrans_perday , and city_pop as input features since they are the most important numeric predictors from our best Random Forest model, as it gave us the highest CV R2 so far.
- We tried local constant fitting, local linear regression and local quadratic regression by choosing different degrees in the loess() function. In the end, we found that when degree = 2 and span = 0.3 we got the best model with CV R2 0.6020646.
- Based on the residual plot, we could see that, while there exists a linear trend, there is still a lot of complexity that is not captured by Local Regression model.
- Neural Network
- 10-fold cross validation with 3 replicates each time to tune nine different Neural Network models with different shrinkage parameters and node degrees. Among all models, we found that the 34-15-1 Neural Network with decay as 0.1 gave us the best performance.
- According to the partial plot of each predictor (Figure 16-18), uniqueday has the most important influence on unit_sales and shows a negative linear effect, which indicates that the consumable items tend to have lower daily unit sales on average. Family , store_type and perishable are also important on unit_sales .
- eXtreme Gradient Boosting (XGB)
- Lastly, we tried XG Boost since it is more computationally efficient than GBM. All numeric predictors including store_avgtrans_perday ,oil price , unique day,city_pop were included in the model. We obtained CV R2 as 0.1160209, which is the lowest so far.
- In order to include categorical variables in the model, we conducted one-hot encoding method to the original dataset, and transformed the result to a sparse matrix.
- After including categorical variables, the new XGB model gave us CV R2 as 0.6722559, which is lower than the result of the Gradient Boosted Tree. The six most important variables from XGB model are uniqueday,
- store_typeD, store_typeE, familyPRODUCE, cluster14, and onpromotion (Table 8 and Figure 19).
5. Model Selection
6. Conclusion
We have generated key predictors that provide important insight in determining items’ unit sales. Specifically, uniqueday , which represents the frequency of item sales, is the most influential predictor on unit_sales . This agrees with all the models we tried on. Store_type , family , oil price , and city_pop are in general influential on unit sales prediction as well, which corresponds with our intuition.